Monday, August 30, 2010

Adding An Appendix to Beamer

I'm preparing for some bigger presentations (Comps, Conferences, Thesis etc ...) and I decided that I wanted to have some appendix slides to answer those tricky questions that come up after the presentation is over.

Beamer claims to have a \appendix function, but it didn't seem to have much effect. My slides present the slide number and total number of slides in the bottom-right, and I don't want the appendix adding to that total.

I found a solution with the appendixnumberbeamer package. With this attached, the \appendix function will reset the page numbering, results in appendices that don't effect the number of slides.

I'm not going to make a sample, you can figure it out

Friday, July 16, 2010

Creating Columns in Articles

I was going to write a blog about this subject, but I found someone else blog that already does it. Rather than be a jerk and steal his (or her) content, I'll just link to it.


The only thing I would add is that, for anybody that uses the \textwidth variable, it still refers to the width of the page, and not the width of the column, so use \columnwidth instead.


Sunday, May 17, 2009

Tabular Row Spacing

We've already covered how to deal with the row height in latex, but what if you want to make only certain rows separated. When designing a table with multiple lines per cell we will use the \hline structure to make the table seem like it has multiple rows.


In this case we need to separate the rows individually, which can be done at the end of the tabular line. Consider the following code:

\begin{tabular}{rl}
{\bf First Column} & {\bf Second Column} \\\hline \\ [-1.5ex]
First Item & First Attribute \\
& Second Attribute \\
& Third Attribute \\ [1ex] \hline \\ [-1.5ex]
Second Item & First Attribute \\
& Second Attribute \\
& Third Attribute \\
& Fourth Attribute \\ [1ex] \hline \\ [-1.5ex]
Third Item & First Attribute \\
& Second Attribute \\ [1ex] \hline \\ [-1.5ex]
Fourth Item & First Attribute \\
& Second Attribute \\
& Third Attribute \\ [1ex] \hline \\ [-1.5ex]
\end{tabular}

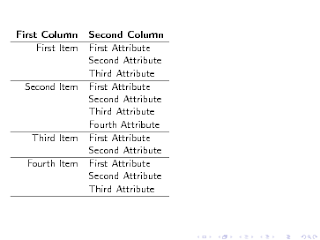
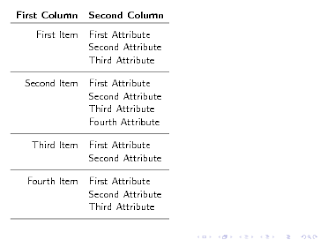
Putting [1ex] at the end of a line creates that much extra space after the line. The idea here is to make 1ex before the \hline, and then put a completely blank line after it. the [-1.5ex] moves the line after the \hline up, making the gap less than a full line. The result is in the following image:

Making Multiline Equations

Just a quick post, as this is something that I've had to do (yet again), so I thought I'd write it down. When you need an equation with multiple lines, say when you're decomposing an equation through several steps, the procedure you should use is eqnarray:

Equation array: eqnarray
usage: \begin{eqnarray} ... \end{eqnarray}

The usage of eqnarray is fairly straight-forward: an equation array is a standard array with three columns formatted to the right, center and to the left {rcl}. The idea is that the left side of the equation is the first statement, the middle column is the = sign and the right column is the derivation. It differs from a standard array in that it is in the formula environment (within the $ environment) so it can take standard mathematical notation. The following example produces a two-line equation:

\begin{eqnarray*}
\Delta D(s,N) & = & D_N(\hat{\mu};,y) - D_{N_L,N_R}(\hat{\mu}_L,\hat{\mu}_R;y)\\
& = & \sum_{i=1}^n D(\hat{\mu};y_i) - \left[\sum_{i=1}^{n_L} D(\hat{\mu};y_i)+\sum_{i=1}^{n_R} D(\hat{\mu};y_i)\right]\\
\end{eqnarray*}

This produces the following equation:

Monday, November 3, 2008

\bar vs. \overline

Another quick post, this time about math. In particular about the \bar option. As many Latex users are aware, the \bar option is used to put a line over a letter/number in math mode, usually representing a mean. The problem with this method is that it puts a fixed-width bar over the letter (I think it's an underscore character '_') instead of covering the width of the letter(s).

This can be easily overcome with the overline option.

overline: \overline
usage: \overline{test}
Explanation: The overline option should be used instead of bar option.

The following code demonstrates the difference

\documentclass[12pt]{beamer}
\mode{
\usetheme{Boadilla}
}
\begin{document}
\begin{frame}[plain]
\begin{alertblock}{WRONG}
\begin{align*}
Z& = \frac{\bar{BMI}-\mu}{\sqrt{\frac{\sigma^2}{N}}} \\
& = \frac{\bar{BMI}-\mu}{SE(\bar{BMI})} \\
\end{align*}
\end{alertblock}
\begin{exampleblock}{RIGHT}
\begin{align*}

Z& = \frac{\overline{BMI}-\mu}{\sqrt{\frac{\sigma^2}{N}}} \\
& = \frac{\overline{BMI}-\mu}{SE(\overline{BMI})} \\
\end{align*}
\end{exampleblock}
\end{frame}
\end{document}

Which produces the following slide

Thursday, October 30, 2008

Formatting Tables

I suppose I should start with the subject that made me start this blog in the first place: formatting tables. Now I'm sure this is the first in a series of posts on tables, as anyone who has worked with them knows how finicky they can be.

The two aspects of tables I'm explaining today are the column and row separation values. For those that are looking for quick fixes, I'll give them to you right away:

Column Width: \tabcolsep
Usage: \renewcommand\tabcolsep{6pt}
Explanation: tabcolsep is HALF the space between two columns. Default value is 6pt

Row Height: \arraystretch
Usage: \renewcommand\arraystretch{1}
Explanation: arraystretch is a FACTOR representing the distance between two rows. Default is 1

The two variables are manipulated in different ways: tablecolsep is a unit, so it can be specified in a variety of ways (pt, ex, em, etc...) which arraystretch is a factor, so it has no units.

The code demonstrates how to manipulate the variables, using beamer slides.

\documentclass{beamer}
\begin{document}
\begin{frame}[fragile]
\begin{tabular}{|c|c|c|c|c|c|c|c|c|c|c|c|c|c|c|}\hline
1 & 2 &3 &4 &5 &6 &7 &8 &9 & a &b &c &d &e &f \\\hline
Wide Column & & & & & & & & & & & & & & \\\hline
\end{tabular}
\renewcommand\arraystretch{1.1}
\renewcommand\tabc
olsep{3pt}
\begin{tabular}{|c|c|c|c|c|c|c|c|c|c|c|c|c|c|c|}\hline
1 & 2 &3 &4 &5 &6 &7 &8 &9 & a &b &c &d &e &f \\\hline
Wide Column & & & & & & & & & & & & & & \\\hline
\end{tabular}
\renewcommand\arraystretch{0}
\renewcommand\tabcolsep{0pt}
\begin{tabular}{|c|c|c|c|c|c|c|c|c|c|c|c|c|c|c|}\hline
1 & 2 &3 &4 &5 &6 &7 &8 &9 & a &b &c &d &e &f \\\hline
Wide Column & & & & & & & & & & & & & & \\\hline
\end{tabular}
\renewcommand\arraystretch{2}
\renewcommand\tabcolsep{6pt}
\begin{tabular}{|c|c|c|c|c|c|c|c|c|c|c|c|c|c|c|}\hline
1 & 2 &3 &4 &5 &6 &7
&8 &9 & a &b &c &d &e &f \\\hline
Wide Column & & & & & & & & & & & & & & \\\hline
\end{tabular}
\end{frame}
\end{document}

Which produces these slides